Born in Scotland over 250 years ago, William Playfair was a dreamer who "saw the world differently from other people." Unfortunately, this skill didn't easily translate into the fame and fortune he hoped for. In fact, it often got him into trouble with family, friends and bosses. But Will's innovative vision did inspire a big idea that would set him apart: he turned numbers into pictures by creating line graphs, bar graphs and pie charts! Numbers as pictures? There's an idea that's off the charts!
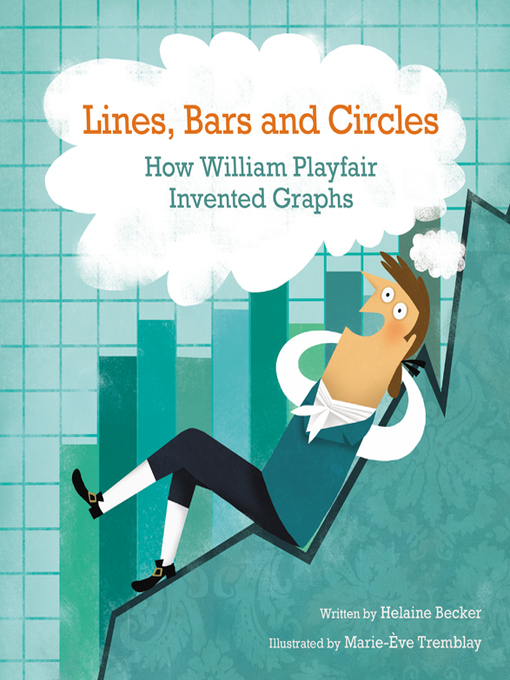
Lines, Bars and Circles
How William Playfair Invented Graphs
1 of 1 copy available
-
Creators
-
Publisher
-
Release date
April 10, 2017 -
Formats
-
OverDrive Read
- ISBN: 9781771388870
-
PDF ebook
- ISBN: 9781771388870
- File size: 3670 KB
-
-
Languages
- English
-
Levels
- Lexile® Measure: 820
- Text Difficulty: 3-4
-
Reviews
-

March 6, 2017
Readers may be surprised to learn that Scottish entrepreneur William Playfair, who invented pie charts and other types of graphs in the 18th century, wasn’t particularly methodical or disciplined. As a child, Playfair preferred drawing and playing pranks to mathematics, and his adulthood was marked by professional and personal blunders: “Every venture failed. Worse, his schemes often got him in trouble.” Becker (Monster Science) takes a fittingly irreverent approach to Playfair’s story, and Tremblay’s (Inside Your Insides) playful digital artwork does the same, even using a red dotted line to “behead” Louis XVI in a spread that mentions the French king’s appreciation of Playfair’s graphs. It’s a modest and quirky underdog story that underscores the rewards of outside-the-box thinking—even when that thinking isn’t always rewarded in one’s lifetime. Ages 6–9. -

February 1, 2017
The origins of the now-ubiquitous line graph, bar graph, and pie chart are rarely considered. This title introduces the Scotsman who first plotted and promoted these tools for easily communicating complex information.When the father of William Playfair (1759-1823) died, his brother John took over the young dreamer's education. John's scientific training had a lasting influence, according to extensive backmatter, which quotes Playfair: "He taught me to know, that, whatever can be expressed in numbers, may be represented by lines." (There are no citations, nor a bibliography, although Playfair's books are mentioned in context.) Becker chronicles a career of dabbling that included apprenticeships with inventors, among them James Watt. She writes clearly with a child audience in mind, highlighting the drama surrounding this economist, entrepreneur, thief, and scoundrel and explaining why graphs did not gain traction in his lifetime: reputation and ideas were inextricably linked, and the prevailing notion was that science was best expressed in numbers and formulas, not frivolous illustrations. Insets summarize the scientific method and the Industrial and French revolutions. Rendered digitally in a predominantly turquoise, blue, and green palette, Tremblay's caricatures (all white before the book reaches the present day) provide comic relief, as when a dotted line severs Louis XVI's head. Two graphs and a pie chart are depicted and deconstructed; original versions occur in the author's note. An unusual and useful curricular choice for today's students, who frequently learn through infographics. (Picture book/biography. 6-9)COPYRIGHT(2017) Kirkus Reviews, ALL RIGHTS RESERVED.
-

March 1, 2017
Gr 1-4-A picture book biography of the inventor of the three most frequently used infographics: the line graph, the bar graph, and the pie chart. William Playfair (1759-1823) grew up in Scotland, was educated by his mathematician and scientist brother, and later worked for inventors Andrew Meikle and James Watt. So why don't more students know his name? The author suggests that even though Playfair was a creative thinker, he was not taken seriously during his lifetime because he was also a scoundrel and a schemer. Another reason is that scientists preferred numbers to Playfair's colorful visuals, which they saw as imaginative rather than scientific. It took more than 100 years for Playfair's ideas to become a popular way of displaying data. A mix of informative and witty illustrations add to the value of this educational, well-written work. (Drawings of Playfair's graphs enhance the narrative and also teach kids how to interpret said graphs.) Back matter further explains Playfair's life and his innovative methods of presenting material. VERDICT The author's evidence-based speculation about why Playfair's charts didn't initially catch on and the smart and playful art combine to produce a welcome option for STEM and biography collections.-Myra Zarnowski, City University of New York
Copyright 2017 School Library Journal, LLC Used with permission.
-

February 1, 2017
Grades 2-5 It can be difficult to find a picture-book biography dedicated to an obscure ne'er-do-well who couldn't keep a job, failed at numerous business ventures, and barely managed to avoid the guillotine during the French Revolution. Yet these events pretty much sum up the life of Scotsman William Playfair, the hopeless dreamer credited with inventing the bar graph, the pie chart, and the line graph. It may be difficult to realize that these representations had to be invented, since they're so embedded into our modern data displays, or that they were dismissed for more than a century, since eighteenth-century Enlightenment doctrine deemed illustrations creative, unreliable flights of imagination. The accessible text manages to convey these abstract ideas while following Playfair's unlucky circumstances, occasionally relying on inset-boxes to explain historical context (scientific method, the Industrial and French Revolutions). The humorous illustrations ease this story along for young audiences, and extensive endnotes fill in gaps for adults. This attractive package about an overlooked subject is a great choice to inspire nascent dreamers and makers.(Reprinted with permission of Booklist, copyright 2017, American Library Association.) -

July 1, 2017
This short-form biography describes inventor and "jack-of-all-trades" William Playfair's road to creating the line graph, bar graph, and pie chart, appreciated only after his death. Like Playfair, illustrator Tremblay thinks outside the box: e.g., a giant-size Playfair stepping out from a building's roof accompanies "Meikle's workshop felt too small to hold all Will's grand dreams." Nuts-and-bolts sidebars and back matter supplement the peppy narrative.(Copyright 2017 by The Horn Book, Incorporated, Boston. All rights reserved.)
-